
How to Fairly Split AI Workload Energy on a Shared Server
Paper: An Energy Cost Model for AI Workloads under Shared Resource Environments — IEEE Internet of Things Journal (IoTJ) 2025
한국어 버전: 한국어로 읽기
GitHub: vm-power-attribution (private)
The Problem: “Same Specs, Same Bill?”
Imagine two teams sharing a single cloud server. One runs ResNet for real-time image classification; the other runs a Node.js web server. Identical resource allocation — 2 CPU cores, 4GB RAM, 1 GPU.
Should they pay the same electricity bill?
Our experiments show a maximum 11× energy gap between these two workloads. Charging GPU-intensive AI and a lightweight web server equally is fundamentally unfair — yet most cloud pricing today is still allocation-based.
This tutorial walks through our full implementation: hardware setup, data collection pipeline, energy attribution model, and validation results. Everything you need to reproduce it yourself.
System Overview
The system has three major layers:
┌────────────────────────────────────────────────────────┐
│                    System Architecture                  │
│                                                        │
│  ┌──────────────────┐    ┌─────────────────────────┐   │
│  │  Measurement     │    │  Attribution Layer       │   │
│  │                  │    │                         │   │
│  │ RPICT4V3         │───▶│  ① system_power.tsv     │   │
│  │ (AC wall power)  │    │     wall/CPU/GPU/Mem     │   │
│  │                  │    │                         │   │
│  │ RAPL             │───▶│  ② workload_usage.tsv   │   │
│  │ (CPU power)      │    │     cpu%/gpu%/IO/Mem     │   │
│  │                  │    │                         │   │
│  │ NVML             │───▶│  ③ Attribution Model    │   │
│  │ (GPU power)      │    │     E_wi = f(resource)  │   │
│  │                  │    │                         │   │
│  │ cgroup v2        │───▶│  ④ Validation           │   │
│  │ (per-workload)   │    │     error < 5%          │   │
│  └──────────────────┘    └─────────────────────────┘   │
└────────────────────────────────────────────────────────┘
The figure below (from the paper) shows the proposed attribution model pipeline in detail:
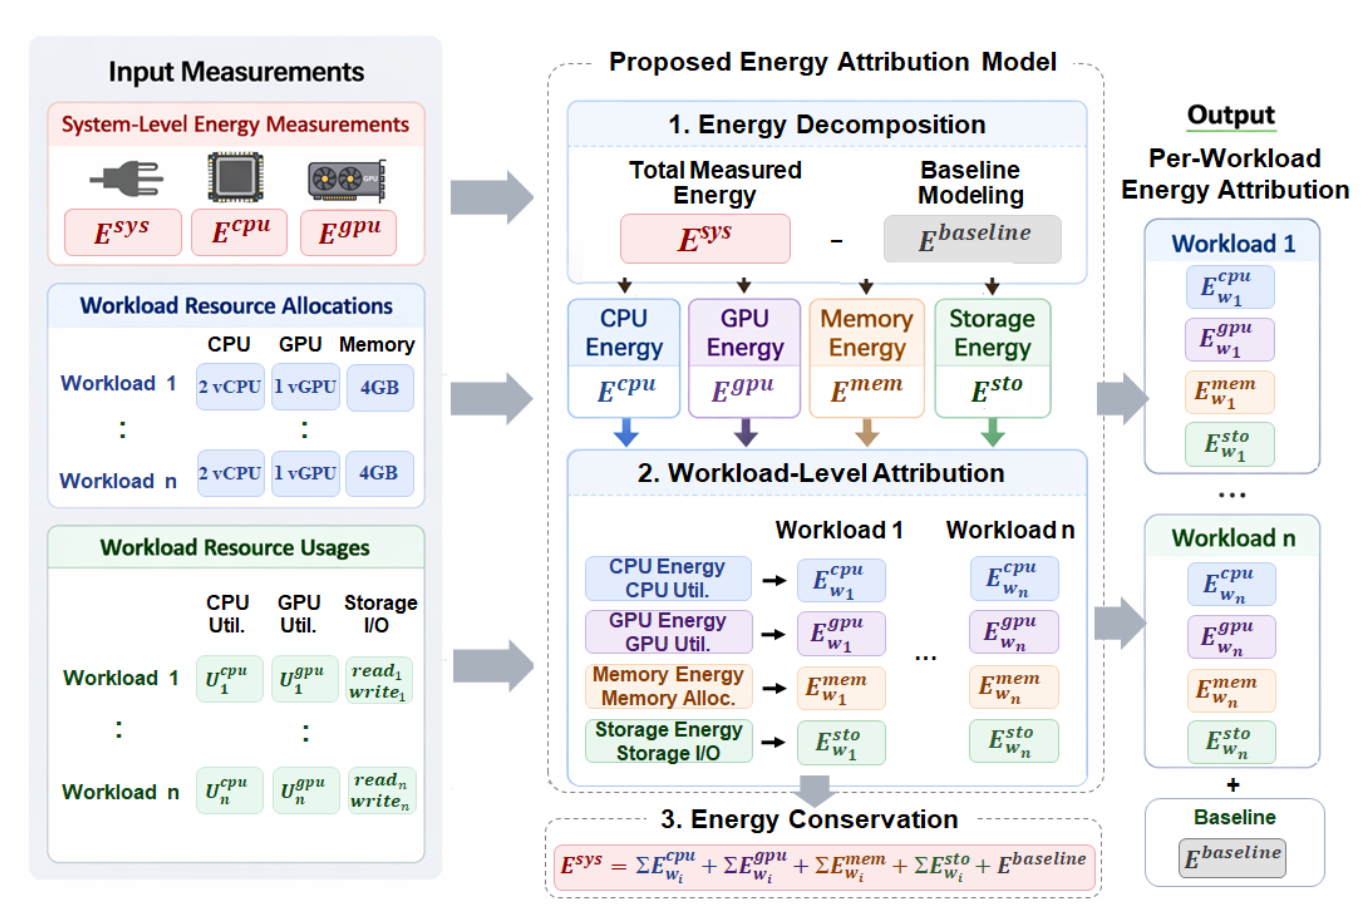 Fig. 2 — From system-level measurements to per-workload energy attribution output
Step 1: Hardware and Environment Setup
1-1. Hardware Configuration
| Component | Model | Role |
|---|---|---|
| Main Server | Alienware Aurora R12 (i7-11700KF, RTX 3060 ×2, 32GB) | Workload execution |
| Power Meter | RPICT4V3 + CT Sensor (SCT-006) | AC wall power measurement |
| Data Collector | Raspberry Pi 4 | RPICT serial data logging |
The RPICT4V3 is mounted as a HAT on the Raspberry Pi. CT sensors are clamped around the server’s power cable to measure AC input power at 1-second intervals. This is the most accurate “ground truth” available.
1-2. Software Stack
# Main server (Ubuntu 22.04)
sudo apt install -y python3-pip python3-venv
pip install torch torchvision transformers ultralytics

# Enable RAPL (CPU power reading)
sudo modprobe intel_rapl_common

# Verify GPU monitoring
nvidia-smi --query-gpu=power.draw --format=csv
1-3. cgroup v2 Setup — Workload Isolation
This is the most critical setup step. cgroup v2 isolates each workload into a dedicated slice, enabling per-workload tracking of CPU usage, memory, and I/O.
# yolo.slice: for AI workloads (CPU 0-1, max 4GB)
sudo mkdir -p /sys/fs/cgroup/yolo.slice
echo "0-1" | sudo tee /sys/fs/cgroup/yolo.slice/cpuset.cpus
echo "0"   | sudo tee /sys/fs/cgroup/yolo.slice/cpuset.mems
echo "4294967296" | sudo tee /sys/fs/cgroup/yolo.slice/memory.max  # 4GB

# nodejs.slice: for web server workloads (CPU 2-3, max 4GB)
sudo mkdir -p /sys/fs/cgroup/nodejs.slice
echo "2-3" | sudo tee /sys/fs/cgroup/nodejs.slice/cpuset.cpus
echo "0"   | sudo tee /sys/fs/cgroup/nodejs.slice/cpuset.mems
echo "4294967296" | sudo tee /sys/fs/cgroup/nodejs.slice/memory.max
Why cgroup? When multiple workloads share a server, we need to know “how much CPU did workload A actually use?” to attribute energy. cgroup is the most accurate OS-level mechanism for per-workload resource accounting.
Step 2: Data Collection Pipeline
With the environment set up, it’s time to actually measure power. Three loggers each capture a different layer of data — skip any one of them and the attribution calculation becomes incomplete.
Three loggers run in parallel during each experiment, capturing different layers of data:
During experiment execution
    │
    ├── host_logger.py    ──▶ RAPL (CPU power) + NVML (GPU power) → CSV
    ├── cgroup_logger.py  ──▶ per-workload CPU%, memory, I/O → CSV
    └── rpict_logger.py   ──▶ AC wall power → CSV (runs on Raspberry Pi)
2-1. host_logger.py — CPU and GPU Power
Collects total system CPU package power (RAPL) and GPU power (nvidia-smi) at 1-second intervals.
class RAPLReader:
    """Read Intel RAPL energy counters and convert to instantaneous power (W)"""

    RAPL_BASE = "/sys/class/powercap/intel-rapl"

    def read_power(self) -> dict:
        current_time = time.time()
        current_energy = {}

        for name, path in self.domains.items():
            try:
                energy_uj = int(path.read_text().strip())
                current_energy[name] = energy_uj
            except (PermissionError, FileNotFoundError):
                continue

        power = {}
        if self.prev_time is not None:
            dt = current_time - self.prev_time
            for name, energy in current_energy.items():
                if name in self.prev_energy:
                    delta = energy - self.prev_energy[name]
                    if delta < 0:
                        delta += 2**32       # handle counter overflow
                    power[name] = (delta / 1_000_000) / dt  # μJ → W
        ...
RAPL provides cumulative energy in microjoules (μJ). Taking the difference between two readings and dividing by elapsed time gives instantaneous power.
Usage:
# Basic (Ctrl+C to stop)
python3 scripts/measurement/host_logger.py -o data/raw/alienware/phase3_fixed/baseline_host.csv

# 60 seconds, 0.5-second interval
python3 scripts/measurement/host_logger.py -d 60 -i 0.5 -o baseline_host.csv
Output CSV columns: timestamp, rapl_package_w, gpu0_power_w, gpu1_power_w, gpu0_util_pct, gpu1_util_pct
2-2. cgroup_logger.py — Per-Workload Resource Usage
Reads CPU utilization, memory, and I/O directly from the cgroup v2 filesystem for each workload slice.
class CgroupReader:
    """Read cgroup v2 statistics"""

    def read_cpu_stat(self) -> Dict:
        """Read actual CPU usage time (μs) from cpu.stat"""
        stat_file = self.path / "cpu.stat"
        content = stat_file.read_text()
        result = {}
        for line in content.strip().split('\n'):
            key, value = line.split()
            result[key] = int(value)
        return result

    def get_cpu_percent(self) -> float:
        """Calculate CPU utilization (%) between two measurement points"""
        now = self.read_cpu_stat()
        elapsed_wall = time.time() - self.prev_time
        elapsed_cpu_usec = now['usage_usec'] - self.prev_cpu_usage
        return (elapsed_cpu_usec / 1e6) / elapsed_wall * 100
Usage:
# Monitor both yolo.slice and nodejs.slice simultaneously
python3 scripts/measurement/cgroup_logger.py \
    -c yolo.slice nodejs.slice \
    -o data/raw/alienware/phase3_fixed/concurrent_cgroup.csv \
    -d 90
2-3. rpict_logger.py — AC Wall Power (Raspberry Pi)
Parses RPICT4V3 serial output on the Raspberry Pi to log AC power. This serves as the ground truth for energy conservation validation.
# Run on Raspberry Pi
python3 scripts/measurement/rpict_logger.py \
    -p /dev/ttyAMA0 \
    -o /home/pi/rpict_log.csv
Time synchronization is critical: All three loggers must have aligned timestamps. Sync both the main server and Raspberry Pi via NTP:
sudo timedatectl set-ntp true # on both machines
Step 3: Energy Attribution Model
With data in hand, it’s time to answer: “who used how much electricity?” The key insight is that you can’t just split it evenly — different hardware resources behave differently. Understand that first, then the code will make sense.
This is the core of the project. Given the collected measurements, how much energy should be attributed to each workload?
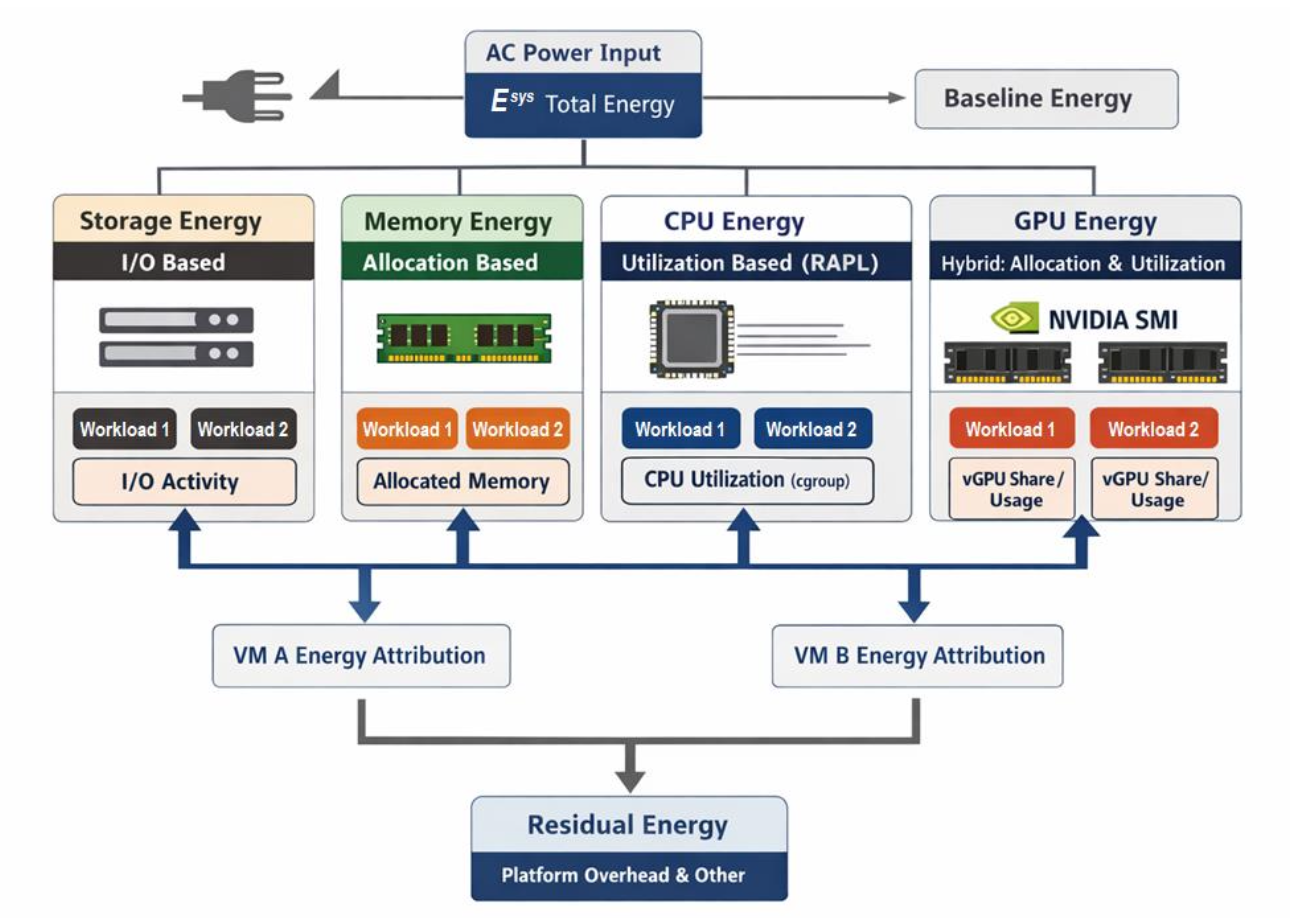 Fig. 1 — Energy model structure applying different attribution rules per resource type
3-1. Why Different Rules for Different Resources?
Energy consumption characteristics differ fundamentally across resource types:
| Resource | Dominant Behavior | Attribution Rule |
|---|---|---|
| CPU | Utilization-proportional | RAPL measurement × CPU utilization ratio |
| GPU | Allocation baseline + activity | Allocation-proportional (base) + utilization-proportional (activity) |
| Memory | Static refresh power dominates | Allocation-proportional (NOT utilization) |
| Storage | I/O activity | Read/write bytes × unit energy coefficient β |
Why is memory allocation-based, not utilization-based?
DRAM must periodically refresh its charge regardless of whether data is being read or written. This static refresh power dominates total memory power consumption. What matters is how much memory is allocated, not how frequently it’s accessed.
Based on LPDDR4 specifications, we use 0.2 W/GB.
3-2. Formal Model
The structure is simple: measure the total, then split by contribution. Here’s how that translates into equations.
First, split the system’s total energy by resource type:
\[E^{sys} = E^{cpu} + E^{gpu} + E^{mem} + E^{sto} + E^{other}\]Then, for each workload $w_i$:
CPU — “If you used X% of the CPU, you pay X% of the CPU energy”: \(E^{cpu}_{w_i} = E^{cpu}_W \cdot \frac{U^{cpu}_i}{\sum_j U^{cpu}_j}\)
GPU — “Pay for what you reserved (allocation) plus what you actually computed (utilization)”: \(E^{gpu}_{w_i} = E^{gpu}_{idle} \cdot a_i + (E^{gpu} - E^{gpu}_{idle}) \cdot \frac{U^{gpu}_i}{\sum_j U^{gpu}_j}\)
Memory — “Pay for what you hold, not what you touch”: \(E^{mem}_{w_i} = E^{mem}_{idle} \cdot \frac{m_i}{M}\)
Sanity check — workload sum + baseline must equal total measured energy: \(E^{sys} = E^{baseline} + \sum_{i=1}^{n} E_{w_i}\)
3-3. Implementation: extract_phase3_data.py
The core function that converts raw measurement CSVs into attribution TSVs:
def process_data(data_dir, rpict_data, phases=None):
    """Process Phase 3 data: raw measurements → attribution results"""

    for phase_name, phase_type, wl_a, wl_b, concurrent_type in phases:
        # 1. Extract stable interval (trim first 15s, last 5s — remove transients)
        host_stable = get_stable_range(host_raw)

        # 2. System-level power measurements
        cpu_power  = avg(host_stable, "rapl_package_w")   # Intel RAPL
        gpu0_power = avg(host_stable, "gpu0_power_w")      # nvidia-smi
        gpu1_power = avg(host_stable, "gpu1_power_w")
        wall_power = get_rpict_avg(rpict_data, t_start, t_end)  # AC input

        # 3. Memory power: LPDDR4 spec (0.2 W/GB × 32GB = 6.4W)
        mem_power = 0.2 * 32

        # 4. Others = Wall - CPU - GPU - Memory (PSU losses, fans, motherboard)
        others_power = wall_power - (cpu_power + gpu0_power + gpu1_power + mem_power)

        # ── Per-workload attribution ──────────────────────────────
        for wl_name, cg_name, gpu_assign, gpu_cards in workloads_info:
            cg_filtered = filter_cgroup(cg_stable, cg_name)

            # CPU utilization from cgroup cpu.stat
            cpu_util = avg(cg_filtered, "cpu_percent")

            # GPU: physically separated (yolo.slice → GPU0, nodejs.slice → GPU1)
            if "yolo" in cg_name:
                gpu_util = gpu0_util
                gpu_pw   = gpu0_power
            else:
                gpu_util = gpu1_util
                gpu_pw   = gpu1_power

            # Memory: allocation-based (cgroup memory.max = 4GB per workload)
            mem_alloc_GB = 4.0
            mem_attributed = 0.2 * mem_alloc_GB  # = 0.8W per workload
System integration: This script takes
*_host.csv(fromhost_logger.py) and*_cgroup.csv(fromcgroup_logger.py) as inputs, and producessystem_power.tsvandworkload_usage.tsv. These TSV files are the input for all result figures (Fig. 4–8).
Step 4: Running the Full Pipeline
Everything from Steps 1–3 connects here. Run these commands in order once, and you get results end-to-end.
4-1. Install Dependencies
# Clone the repo, then:
cd vm-power-attribution
python3 -m venv venv && source venv/bin/activate
pip install -r requirements.txt

# Separate venv for AI workloads (CUDA required)
cd scripts/workloads
python3 -m venv yolo_venv && source yolo_venv/bin/activate
pip install torch torchvision transformers ultralytics
4-2. Configure cgroups
sudo ./scripts/workloads/setup_cgroups.sh
4-3. Run Experiments
# Full automated experiment (sudo required for cgroup control)
sudo -E ./scripts/workloads/run_experiment_phase3.sh
The script runs 16 experiment phases automatically:
Baseline (60s)
  ↓ (20s cooldown)
Solo workloads ×5: YOLO, ResNet18, GPT-2, PyTorch GEMM, Node.js (90s each)
  ↓
AI + Node.js concurrent ×4: YOLO+Node, ResNet+Node, GPT2+Node, PyTorch+Node
  ↓
AI + AI concurrent ×6: YOLO+ResNet, YOLO+GPT2, ResNet+GPT2, ...
4-4. Extract and Analyze
# Convert measurements → attribution TSVs
python3 scripts/analysis/extract_phase3_data.py --run run1

# Inspect results
cat reports/phase3/system_power.tsv
cat reports/phase3/workload_usage.tsv

# Generate figures (reproduces Fig. 4–8)
python3 scripts/analysis/comprehensive_analysis.py
Results: Proving the Unfairness with Numbers
The Full Picture: Experiment Timeline
The figure below shows the entire experiment as a single time-series. From left to right: idle → solo execution → concurrent execution. Notice how power spikes the moment any AI workload starts.
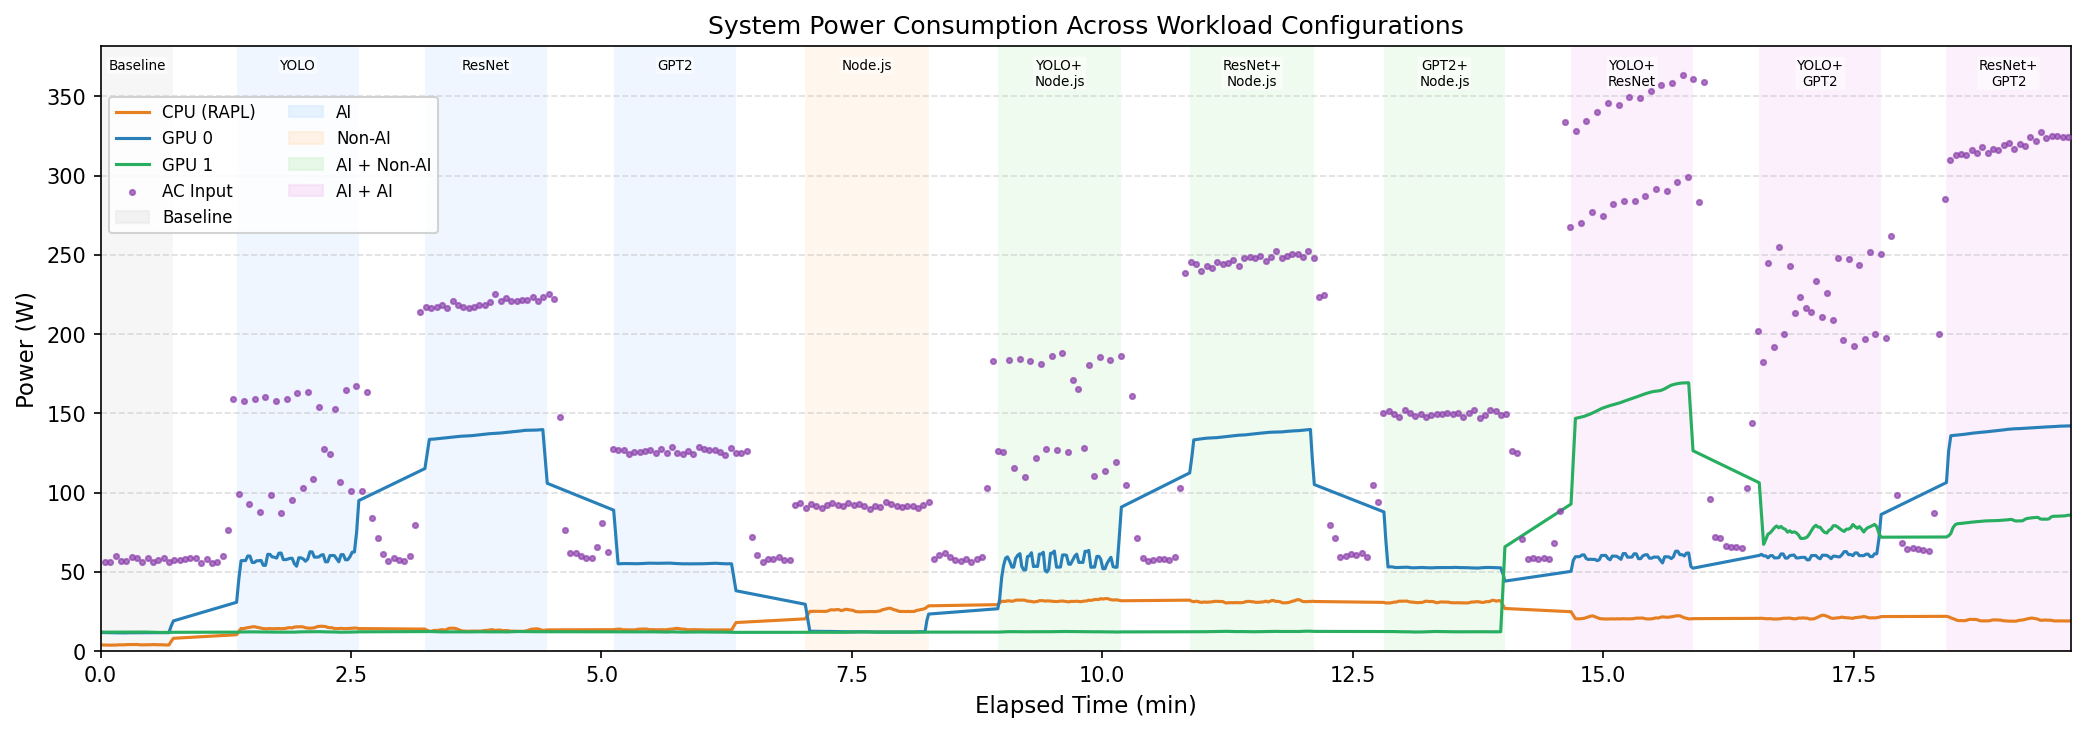 Fig. 3 — The instant ResNet kicks off, GPU power jumps from ~15W to ~150W. The right side shows concurrent execution phases where two workloads overlap.
Solo Execution: Energy Profiles
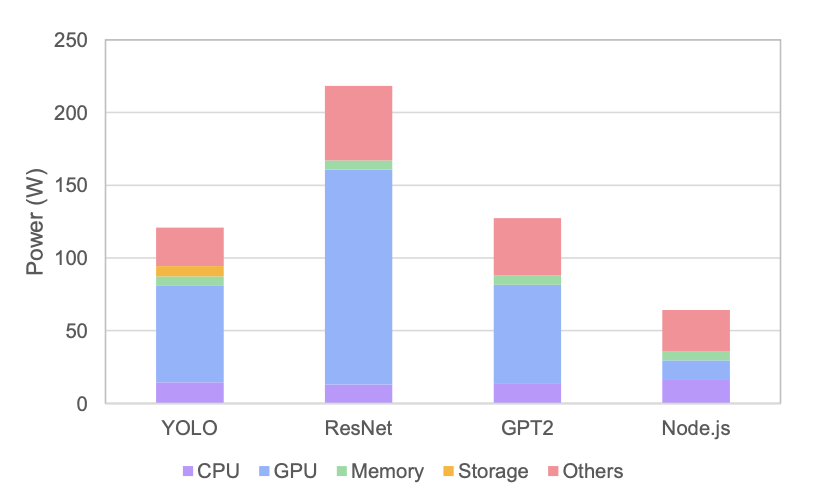 Fig. 4 — System-level power breakdown per workload. GPU dominates AI workloads (53–68%).
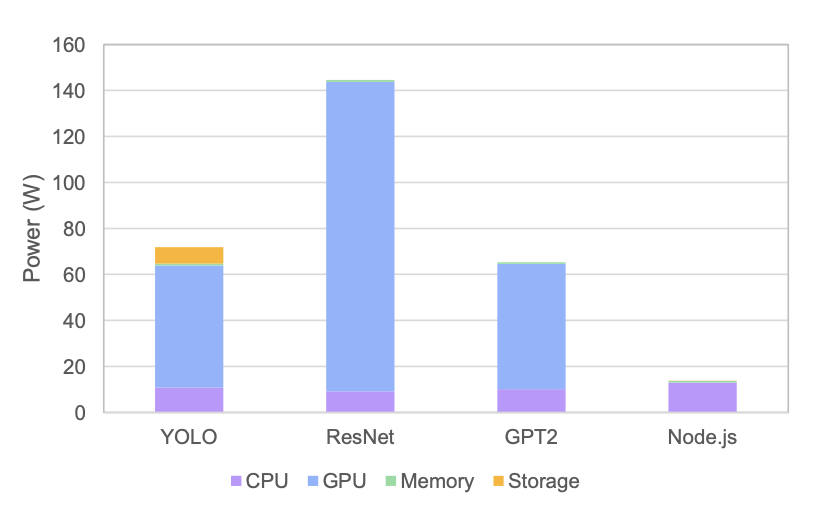 Fig. 5 — Workload-induced power after removing idle/baseline. The ResNet vs. Node.js gap becomes even more pronounced.
Key measured values:
| Workload | CPU Power | GPU Power | Memory | Total |
|---|---|---|---|---|
| ResNet18 | ~9W | ~118W | 0.8W | ~128W |
| YOLO Medium | ~10W | ~44W | 0.8W | ~55W |
| GPT-2 | ~9W | ~39W | 0.8W | ~49W |
| Node.js | ~20W | ~0.2W | 0.8W | ~21W |
ResNet : Node.js ≈ 6.2× — same resource allocation, 6× energy difference.
Concurrent Execution: Shared Resource Dynamics
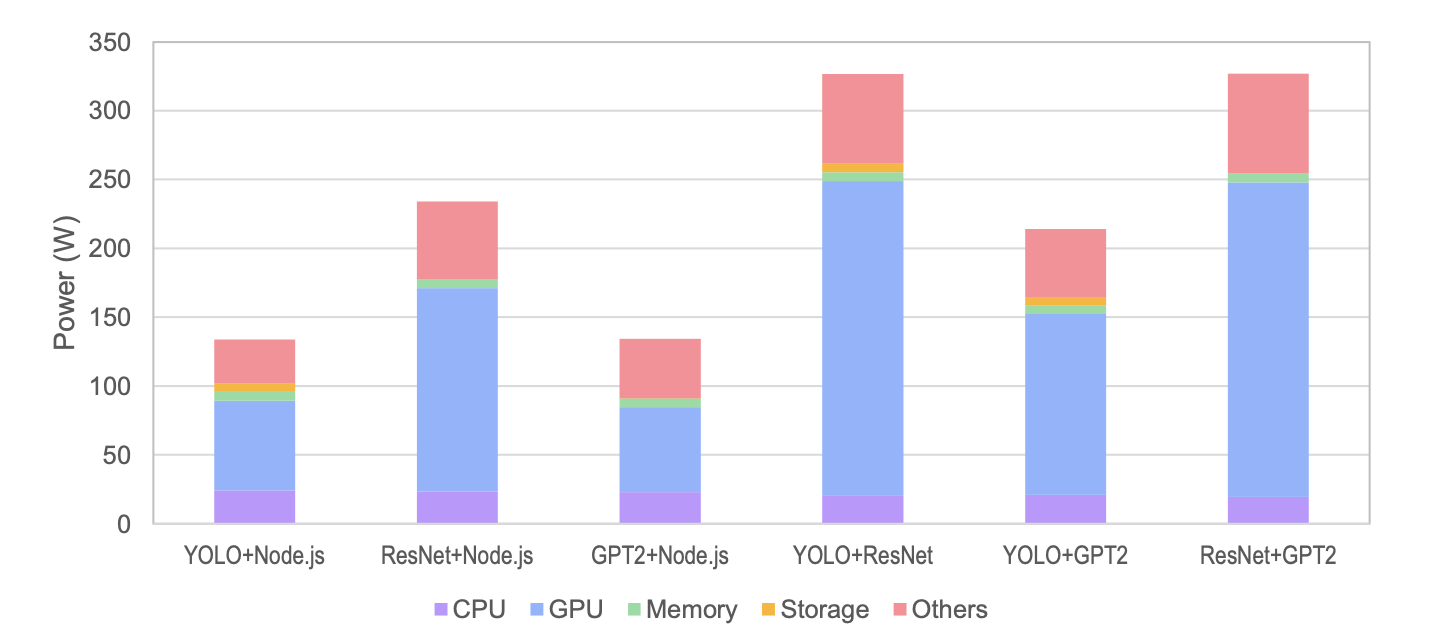 Fig. 6 — System power under concurrent execution. AI+AI combinations exceed 300W.
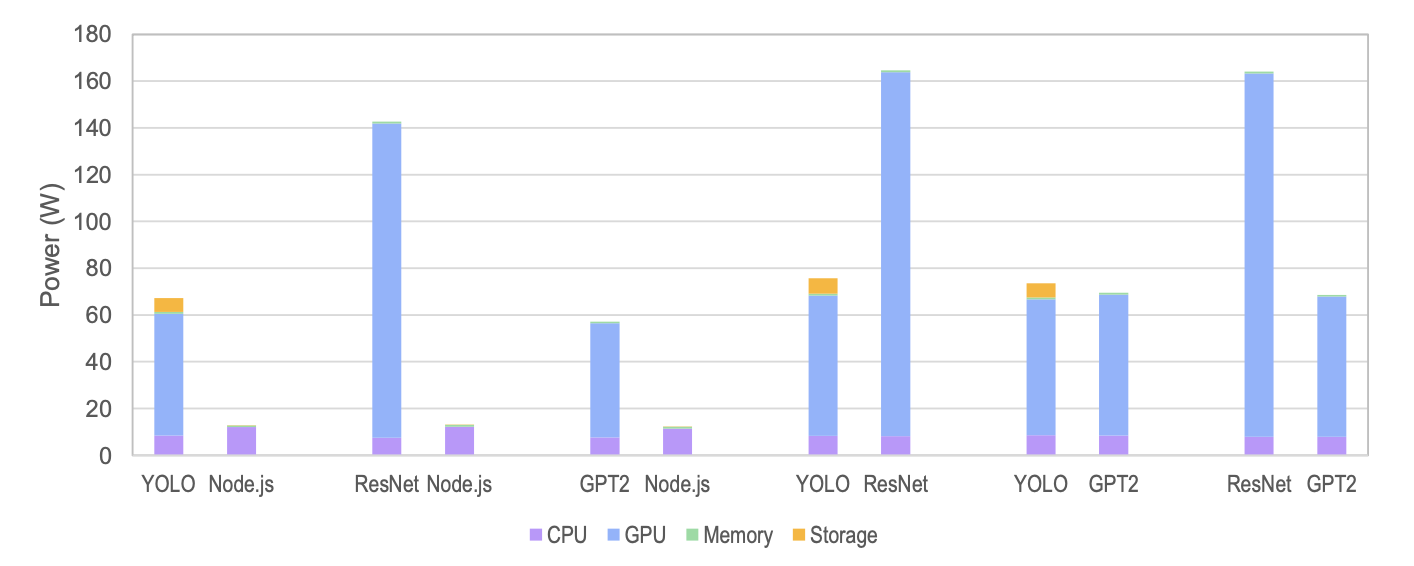 Fig. 7 — Per-workload attribution under concurrent execution. Profiles remain consistent with solo execution.
In AI+Node.js combinations, energy differences reach 4.7–11.0×. Allocation-based billing ignores this completely.
Model Validation: Under 5% Error
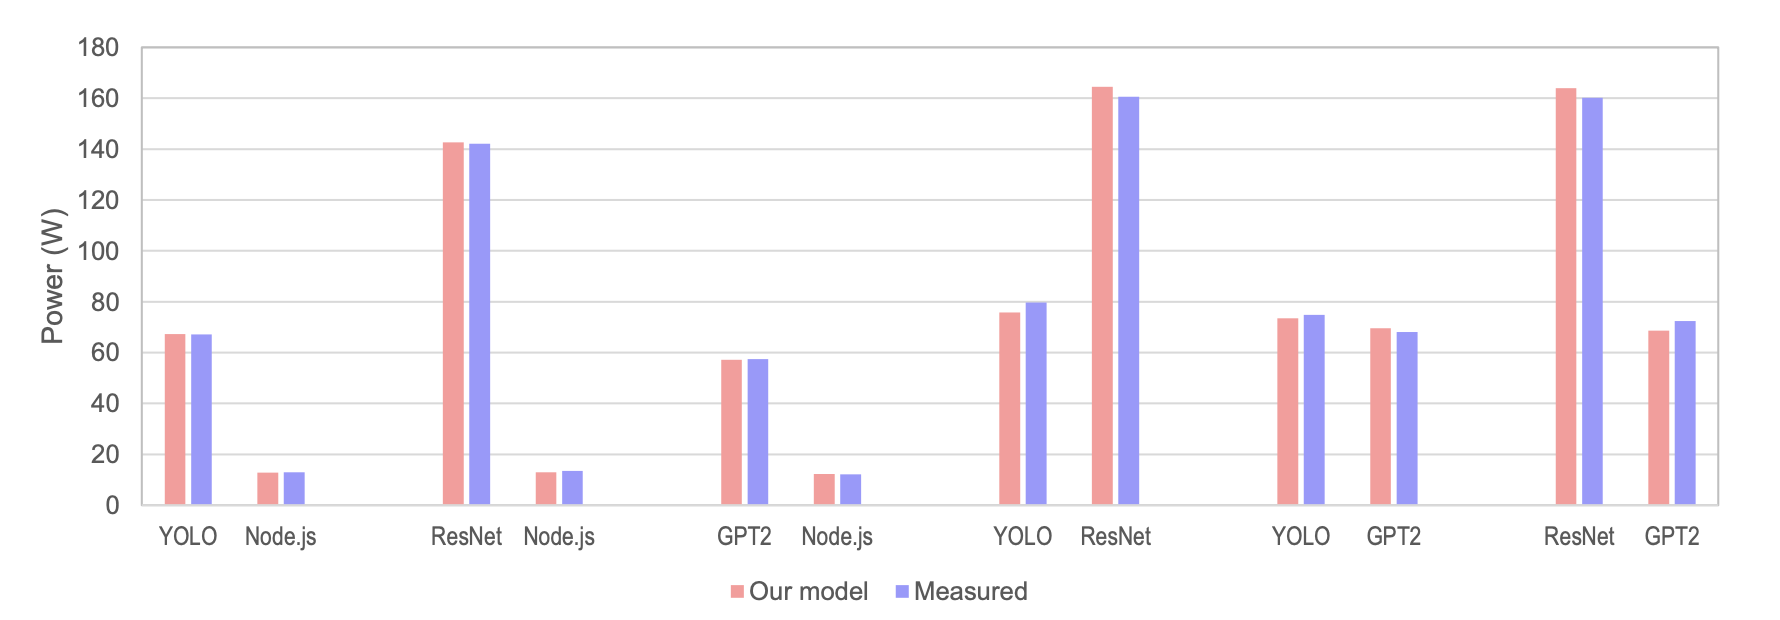 Fig. 8 — Model-attributed values (red) vs. independently measured values (blue). All combinations within 5%.
Attribution errors:
- AI+Node.js: AI workloads 0.1–0.4%, Node.js 0.4–4.1%
- AI+AI (asymmetric power): average 3.7%
- AI+AI (similar power, e.g. YOLO+GPT2): 1.8–2.0%
This accuracy is achieved using only existing OS interfaces — RAPL, nvidia-smi, cgroup — with no additional instrumentation.
Lessons Learned
These are the pain points we hit. If you’re setting up something similar, knowing these in advance will save you hours.
🔴 Issue 1 — RPICT timestamp misalignment
| Symptom | Runs 2–6: wall power reads identical to baseline (~57W) regardless of workload |
| Cause | Clock drift between the main server and Raspberry Pi caused timestamp mismatch during log alignment |
| Fix | sudo timedatectl set-ntp true on both machines; use Run 1 data as the AC power reference |
🔴 Issue 2 — Wall power missing in AI+AI concurrent runs
| Symptom | wall_W = 0 for YOLO+ResNet, YOLO+GPT2, ResNet+GPT2 combinations |
| Cause | RPICT logger stopped responding during the time window those pairs were running |
| Fix | Read approximate values from Fig. 6 visually (averaged from adjacent intervals) |
🟡 Issue 3 — Paper values vs. raw data discrepancy
| Symptom | Paper states Node.js system power = 64W; raw data shows 77.9W |
| Cause | Paper cites a specific run under fixed-frequency conditions; raw data is a 6-run average |
| Fix | This blog uses raw data values (6-run average) for reproducibility |
Conclusion
This project started from a simple question: “Is it fair to charge the same for the same hardware allocation?”
To answer it, we connected a hardware power meter, isolated workloads with cgroup, read component-level power via RAPL and NVML, and built an attribution model with resource-specific rules.
The answer is clear — allocation-based billing creates up to 11× unfairness in modern AI-dominated edge servers. And we can correct it to within 5% using only what the OS already provides.
This work has been submitted to the IEEE Internet of Things Journal (IoTJ).
Previous post: VM-level AI Workload Energy Measurement Research Journey (Dec 2024)